| เราพยายามที่จะ จำกัด วงเว็บไซต์ของเราในภาษามากที่สุดเท่าที่เป็นไปได้ แต่หน้านี้ในปัจจุบันคือเครื่องแปลโดยใช้ Google แปล | ใกล้ |
-
-
ผลิตภัณฑ์
-
แหล่งที่มา
-
สนับสนุน
-
บริษัท
-
ล็อกอิน (or เข้าระบบ)
-
.sy3 นามสกุลของไฟล์นามสกุล
ผู้พัฒนา: Harvard Graphicsประเภทไฟล์: Harvard Graphics Symbol Fileคุณอยู่ที่นี่เพราะคุณมีไฟล์ที่มีนามสกุลไฟล์ที่ลงท้ายด้วย .sy3. ไฟล์ที่มีนามสกุลไฟล์ .sy3 สามารถถูกเปิดตัวโดยการใช้งานบาง เป็นไปได้ว่า .sy3 ไฟล์ที่เป็นไฟล์มากกว่าข้อมูลเอกสารหรือสื่อซึ่งหมายความว่าพวกเขาไม่ได้หมายถึงการจะดูที่ทั้งหมดสิ่งที่เป็น .sy3 ไฟล์
แฟ้มสัญลักษณ์กราฟิกฮาร์วาร์ถูกรวมเข้ากับข้อความและคุณลักษณะการจัดรูปแบบไบนารีโดยใช้ซอฟแวร์ฮาร์วาร์นำเสนอเอกสารกราฟิกและเหล่านี้แฟ้มสัญลักษณ์กราฟิกฮาร์วาร์จะดำเนินการนอกจากนี้ยังมีคุณสมบัติการเข้ารหัสไฟล์และข้อมูลที่เป็นกรรมสิทธิ์เป็นกราฟิกฮาร์วาร์สำหรับรูปแบบไฟล์ SY3 มาตรฐาน XML-based จะดำเนินการนอกจากนี้ยังมีในเนื้อหาเหล่านี้กราฟิกฮาร์วาร์แฟ้มสัญลักษณ์ ข้อมูลที่มีอยู่ในกราฟิกฮาร์วาร์ไฟล์สัญลักษณ์รวมถึงรายชื่อของสัญลักษณ์และตัวอักษรพิเศษที่สามารถใช้ร่วมกับข้อความและวัตถุดิจิตอลป้อนโดยผู้เขียนไฟล์สัญลักษณ์กราฟิกฮาร์วาร์โดยใช้โปรแกรมการสนับสนุนการนำเสนอเอกสารกราฟิกฮาร์วาร์ เหล่านี้กราฟิกฮาร์วาร์แฟ้มสัญลักษณ์ที่ถูกสร้างขึ้นโดยอัตโนมัติและแก้ไขโดยซอฟต์แวร์ที่ฮาร์วาร์นำเสนอเอกสารกราฟิกเมื่อผู้ใช้ป้อนตัวอักษรพิเศษและสัญลักษณ์ในโครงการนำเสนอเอกสาร ซึ่งหมายความว่าเมื่อผู้ใช้ดูเนื้อหาของโครงการนำเสนอเอกสารโดยใช้ซอฟแวร์ฮาร์วาร์นำเสนอกราฟิกแฟ้มสัญลักษณ์ฮาร์วาร์กราฟิกที่สอดคล้องตั้งอยู่โดยการประยุกต์ใช้และข้อมูลที่เก็บไว้ในแฟ้ม SY3 มีการอ้างอิงแล้วสำหรับโปรแกรมที่จะสามารถ แสดงตัวอักษรพิเศษและสัญลักษณ์ที่เพิ่มขึ้นโดยผู้เขียนได้นำเสนอเอกสารโครงการ เหล่านี้กราฟิกฮาร์วาร์แฟ้มสัญลักษณ์ที่ติดอยู่กับ .sy3 ขยายวิธีการเปิด .sy3 ไฟล์
เปิดตัว .sy3 แฟ้มหรือไฟล์อื่น ๆ บนเครื่องคอมพิวเตอร์ของคุณโดยดับเบิลคลิกที่มัน ถ้าความสัมพันธ์ของแฟ้มของคุณจะถูกตั้งค่าอย่างถูกต้องโปรแกรมประยุกต์ที่หมายถึงการเปิดของคุณ .sy3 แฟ้มจะเปิดมัน มันเป็นไปได้ที่คุณอาจจำเป็นต้องดาวน์โหลดหรือซื้อโปรแกรมที่ถูกต้อง นอกจากนี้ยังเป็นไปได้ว่าคุณมีโปรแกรมที่ถูกต้องในเครื่องคอมพิวเตอร์ของคุณ แต่ .sy3 ไฟล์ที่ยังไม่ได้ที่เกี่ยวข้องกับมัน ในกรณีนี้เมื่อคุณพยายามที่จะเปิด .sy3 ไฟล์ที่คุณสามารถบอก Windows ที่แอปพลิเคที่ถูกต้องสำหรับแฟ้มที่ จากนั้นเปิด .sy3 แฟ้มจะเปิดโปรแกรมที่ถูกต้อง คลิกที่นี่เพื่อแก้ไขความสัมพันธ์ของแฟ้ม .sy3 ข้อผิดพลาดการใช้งานที่เปิดได้ .sy3 ไฟล์
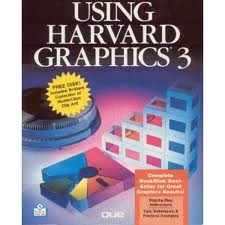
 Harvard Graphics Version 3
Harvard Graphics Version 3
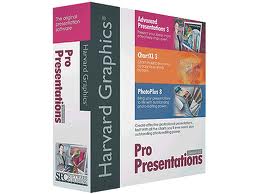
Harvard Graphics Pro Presentations 3 is a comprehensive package containing Harvard Graphcis Advanced Presentations 3, Harvard Graphics ChartXL 3, Serif MediaPlus, Serif PhotoPlus 8 Program and Resource CD and Harvard Graphics Viewer. You can drag and drop between all these applications with Object Linking and Embedding [OLE]. Harvard Graphics Advanced Presentations 3 features animated characters, 3D effects, hundreds of new options for design, new revolutionary special effects, use Flash to publicize your work on the Web, export and import filters for conversion to and from PowerPoint. Add this to the classic features of Harvard Graphics such as pre-designed presentations from business plans to project analysis, design and content step-by-step guidelines, Quick Tips, point-and-click graphics and fonts and various kinds of charts. Harvard Graphics ChartXL 3 features over 300 charts, built-in spreadsheet, data and chart viewer, computation for trends, interpolations and averages, analysis tools, Range Highlighter for correct entry of data, visually locating your data using Data Cursor, colors schemes and chart design with advanced graphics. Serif PhotoPlus 8 features Instant Effects Gallery with surface effects and 3D lighting, depth maps for 3D painting, photo correction tools, export optimizer, smart resize and advanced alignment, shape drawing and freehand and Bezier curve, tools for Web animation, editable QuickShapes, warp tools and versatile deform and productive MDI interface. Serif MediaPlus 1 is a photo and media management tool that provides you amazing slideshows, powerful browsing, fantastic albums, online albums, great printed albums, instant downloading, image capture and screensavers. The Advanced Presentations Viewer allows anyone to view your presentation even without Harvard Graphics software. Harvard Graphics Presentation Software
Harvard Graphics Presentation Software
Harvard Graphics Easy Presentations software provides you with the design tools for step-by-step guidelines on content and design for your presentations with its Advisor feature. Quick Tips help you save time by featuring handy shortcuts for your work. It will direct you to the common tasks to get your work done quickly, and save your time from learning the software. The Design Tips will give you information on how to make your project presentable and creatively convincing. Design Checker will organize your ideas into their proper order and layout. Before you finalize your work, this feature will inform you if your data has any design or style problems, then it will fix the problems automatically for you. Quick Looks will help you find the perfect layout for your work without modifying your current one. It also features 15,000 clip art images, drag and drop of graphics and images from other Windows programs, effects for your bullets and titles, different kinds of charts, VCR-like buttons and Quick View feature so that your audience can view your presentation even if they don’t have Easy Presentations software. Minimum requirements are IBM-compatible Pentium PC with Windows 95/98/98/98SE/NT4 [service pack 3]/M3/2000/XP [single user mode], 16MB RAM, 14-38MB hard disk space, VGA Display Color SVGA, CD ROM drive and mouse. Harvard Graphics ChartXL
Harvard Graphics ChartXL
Harvard ChartXL is a presentation software that combines professional layout and graphic capabilities with advanced organization of data and tools for analysis to facilitate the understanding of charts especially for large and complex volumes of data. With its revised interface for ChartXL 3.0, the product’s legacy features are combined with new capabilities to match current technologies for the benefit of its users. It has more than 300 statistical, business and technical charts to choose from. It has an AutoFit technology that allows you to change styles without affecting your data. The Advisor explains to you the use of each of the 300 charts in order to help you decide the best chart suitable for your data. ChartXL has its built-in spreadsheet application for you to work on that is similar to other famous spreadsheet applications so you won’t have to worry about learning how to use it. It includes multiple workbooks, fonts, numbers and graphic-formatting functions. It provides a split view for your simultaneous viewing of your spreadsheet and chart, eliminating the inconvenience of flip-flopping between two views. The Business Statistics toolbar is a one-touch feature that provides icons for one-click calculation of averages, interpolations, standard deviations, trends and variances. Define your cell range and use one of the 69 predefined functions for ChartXL to quickly analyze your formula. It also performs eclectic analysis by using functions such as kronecker delta and hyperbolic sine. It features Formula Visualizer that evaluates and creates equations for sophisticated surface and curve charts. You can create layers of data using Add Data command, while the Range Highlighter helps you to correct data entry confusion. You can locate your data visually using data cursor, apply professionally presentable color schemes, design charts with advance graphic support, use scale, rotation and perspective tools to apply various perspectives, export and import charts and data in several formats such as data, text, DIF, GIF, PNG, JPEG and metafile. It runs on Windows 95/98/98SE/ME/NT4.0/2000/XP [single user]. It requires 486 to Pentium or higher, 8MB RAM, 18MB hard disk space.คำเตือน
ระวังไม่ให้เปลี่ยนชื่อนามสกุลใน .sy3 ไฟล์หรือไฟล์อื่น ๆ ซึ่งจะไม่เปลี่ยนประเภทของไฟล์ เพียง แต่ซอฟต์แวร์แปลงพิเศษที่สามารถเปลี่ยนไฟล์จากไฟล์ประเภทหนึ่งไปยังอีกสิ่งที่เป็นนามสกุลของไฟล์หรือไม่
นามสกุลไฟล์เป็นชุดของสามหรือสี่ตัวอักษรที่ส่วนท้ายของชื่อไฟล์นั้นในกรณีนี้ .sy3. นามสกุลไฟล์ที่บอกคุณว่าชนิดของไฟล์ที่เป็นของ Windows และบอกสิ่งที่โปรแกรมสามารถเปิดได้ หน้าต่างมักจะร่วมโปรแกรมเริ่มต้นที่จะขยายแต่ละไฟล์เพื่อที่ว่าเมื่อคุณดับเบิลคลิกที่ไฟล์โปรแกรมที่เปิดโดยอัตโนมัติ เมื่อโปรแกรมที่ไม่ได้อยู่บนเครื่องคอมพิวเตอร์ของคุณบางครั้งคุณสามารถได้รับข้อผิดพลาดเมื่อคุณพยายามที่จะเปิดไฟล์ที่เกี่ยวข้องแสดงความคิดเห็น

